 Relevancy and Engagement
agclassroom.org/

Crop Intensity Maps
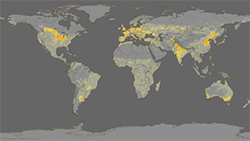
The images on this site show crop intensity data (regions that produce the most crops), followed by the cropland products of 26 countries that produce 82% of the world's food. The final image shows the the population density in 2002 and the projected population in 2050.
URL
Author
NASA Scientific Visualization Studio
Lessons Associated with this Resource
- Journey 2050 Lesson 5: Land Use (Grades 6-8)
- Increasing Food Production with Precision Agriculture
- Food Systems Feed the World
- Agricultural Production Regions in the United States
- Filling the Global Grocery Bag
- Journey 2050 Lesson 5: Land Use (Grades 9-12)
- Global Trade and Interdependence
- Global Food Security