 Relevancy and Engagement
agclassroom.org
Relevancy and Engagement
agclassroom.org
The Environmental Cost of Food
Grade Level
6 - 8
Purpose
Students examine the environmental footprint of food by discovering factors along the farm-to-fork process that contribute to a food's environmental footprint and discuss possible solutions to create a sustainable future through the foods we eat. Grades 6-8
Estimated Time
1-2 hours
Materials Needed
Engagement:
- The Price is Right: The Cost of Food Kahoot
- Alternative: Use slide deck to play the game. Make your own copy.
Activity 1: What contributes to the environmental footprint of food?
- The Environmental Cost of Food slide deck
- Save your own copy of the slide deck
- The Environmental Cost of Food student handout, 1 copy per student
- What contributes to the environmental impact of food? video clip
Activity 2: Identifying Environmental Impact from Farm-to-Fork
- The Environmental Cost of Food slide deck (continued)
- The Environmental Cost of Food student handout (continued)
- Tutorial video
- Environmental Footprint by Food Group cards, 1 copy per class printed front to back*
- Human Impact Coins*
- Round Sticker Labels printed on Avery Presta 94500 label sheet, 3 copies per class
- 1" wood discs,
- You may also print the sticker labels on cardstock and cut the labels apart if that makes lesson preparation easier.
- Flowcharts, 1 copy of each flow chart per class*
*These items are available in a classroom-ready kit, Environmental Cost of Food, available from agclassroomstore.com.
Vocabulary
byproduct: an incidental or secondary product made in the manufacture or synthesis of something else
feed crops: crops produced primarily for consumption by animals
human impact: changes to Earth's environment and to ecosystems caused directly or indirectly by humans
Did You Know?
- When you throw away food, you're also wasting the energy, land, water, and fertilizer that was used to produce, package, and transport it.1
- Twenty six percent of greenhouse gas emissions come from food.2
- The carbon footprint of food can change when produced in different places or using different production methods.3
- Transporting food by air emits around 50 times as much greenhouse gases as transporting the same amount by sea.4
Background Agricultural Connections
The environmental footprint of food encompasses the range of ecological impacts associated with producing, processing, transporting, and consuming what we eat. Eating is necessary to sustain life, but it does contribute to human impact on our world. This footprint includes factors such as greenhouse gas emissions, water usage, land degradation, and biodiversity loss. For instance, livestock farming is a contributor to methane emissions and deforestation, while intensive crop production can lead to soil erosion and excessive water consumption. Understanding and mitigating these impacts is crucial for fostering a more sustainable food system and reducing our overall environmental footprint.
Environmental Cost of Food
The ecological food footprint, often referred to as the environmental footprint of food, or a "foodprint" takes into account various factors that measure the environmental impact of producing, processing, transporting, and consuming food. Some of the key factors considered in the ecological food footprint include:
-
Land Use: The amount of land required for agricultural production, including crop cultivation, grazing, and feed crop production. This accounts for both direct land use and land used for feed production. It can also include the impact of agricultural practices on soil health, erosion, and degradation.
-
Water Use: The amount of water required for irrigation, animal drinking, and processing throughout the food supply chain. This includes both direct water use and the water embedded in food production. The pollution of water bodies from nutrient runoff, pesticide residues, and other contaminants associated with agricultural activities should also be evaluated.
-
Greenhouse Gas Emissions: The emissions of greenhouse gases such as carbon dioxide, methane, and nitrous oxide are associated with food production, transportation, and processing. These gases contribute to global warming and climate change.
-
Energy Consumption: The energy required for various stages of food production, including planting, cultivation, harvesting, processing, transportation, and storage.
-
Waste Generation: The generation of waste materials along the food supply chain, including packaging waste and food waste.
-
Inputs: The ecological footprint of resources used to produce inputs like fertilizers, pesticides, and machinery for food production. Includes the use of pesticides, herbicides, fertilizers, and other chemicals in food production that can affect soil and water quality and impact ecosystems.
-
Transportation: The energy and emissions associated with transporting food from production sites to processing facilities, markets, and consumers.
These factors collectively contribute to understanding the overall environmental impact of food production and consumption. Life cycle assessment (LCA) is a common method used to quantify the ecological food footprint by considering all stages of the food supply chain. Life cycle assessments could be made for all consumer items. Efforts to reduce the ecological food footprint involve adopting sustainable farming practices, improving resource efficiency, reducing waste, and promoting responsible consumption patterns.
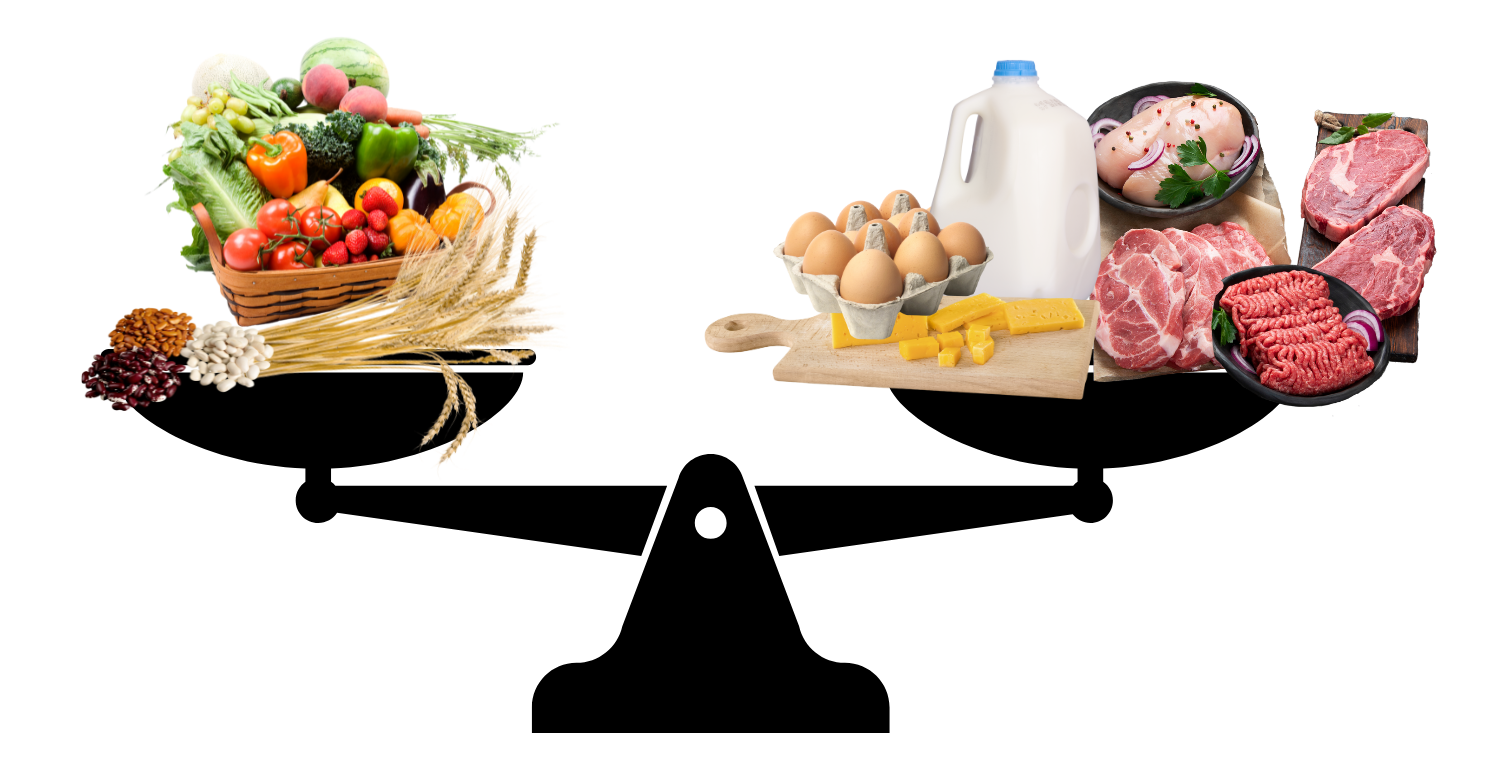
Animal-source Foods
The livestock industry encompasses various aspects of animal agriculture that involve the raising, breeding, and utilization of animals for various purposes. This industry provides a wide range of products and services that are essential for human consumption, economic growth, and other applications. Livestock animals provide the following:
- Meat: The primary purpose of livestock in many societies is to produce meat for human consumption. This includes beef, pork, poultry (chicken and turkey), lamb, and other types of meat. Meat serves as a significant source of protein, vitamins, and nutrients in human diets.
- Dairy: Livestock, particularly cattle, are raised for dairy production, providing milk, cheese, yogurt, butter, and other dairy products. Dairy products are rich in calcium, protein, and other nutrients and are widely consumed around the world.
- Eggs: Poultry, such as chickens, are raised for egg production, supplying a vital source of protein and nutrients to diets globally.
While meat, dairy products, and eggs are the primary products produced by livestock, there are also many secondary products, or byproducts as well. The livestock industry provides leather, fertilizer, pet food, fiber, and ingredients used in wax paper, crayons, margarine, paints, rubber, candles, soaps, cosmetics, shaving creams, gelatin, and more. Livestock also provide employment and economic opportunities and play important roles in some cultural and traditional practices, rituals, and ceremonies throughout the world.
Plant-source Foods
Plants are essential to our diet as they provide a wide array of vital nutrients, including vitamins, minerals, fiber, and antioxidants, which are crucial for overall health and well-being. They help reduce the risk of chronic diseases such as heart disease, diabetes, and cancer, while also promoting digestive health and supporting a healthy weight. Additionally, plant-based foods contribute to a more sustainable food system, offering a lower environmental footprint compared to animal-source products. Incorporating a diverse range of plants into our diet not only supports personal health but also benefits the planet.
- Fruits and Vegetables: The most popular fruits in the United States are apples, bananas, oranges, grapes, and strawberries. The most common vegetables are potatoes, tomatoes, carrots, lettuce, and onions.
- Grains: Grains such as wheat, rice, corn, oats, and barley are the foundation of many meals and snacks and provide essential carbohydrates, fiber, and nutrients.
- Legumes: A variety of beans, lentils, peas, and soybeans are part of a balanced diet and a rich source of protein, fiber, vitamins, and minerals.
Engage
- Ask students to think about the "cost" of food. Begin discussion to see what your students know about the cost of foods at the grocery store or a restaurant.
- Play the Kahoot, The Price is Right: The Cost of Food. The first questions focus on the financial cost of food at the grocery store. Later questions shift to the amount of water required to produce particular foods and the amount of greenhouse gases that are emitted to produce specific foods.
- Note: The food prices used in the Price is Right game were gathered from the Walmart shopping app. Food prices can vary significantly by region and seasons throughout the year. If the numbers in the game do not represent your local costs, make a copy of the Kahoot/Google slides and edit it to reflect your region. The water calculations were taken from Water Footprint Calculator. The greenhouse gas emission calculations were reported from United Nations: Climate Action.
- After students have completed the Kahoot, ask if they have ever thought about the "cost" of food outside of the amount of money it costs to purchase it. Did they know that there is a "cost" to our environment to produce food?
- Introduce (or review) the definition of the scientific term, human impact. Explain that part of our impact on the environment includes the production of our food.
Explore and Explain
Activity 1: What contributes to the environmental footprint of food?
- Project the attached slide deck, The Environmental Cost of Food. Ask students what kind of supplies they need to bake cookies. Students should easily list food ingredients such as flour, sugar, or eggs (slide 2). If they stop there, prompt them to think about measuring cups, bowls, an electric mixer, and an oven. Prompt even further to ask what is needed for the oven to work (electricity or natural gas) or what was used to make the plastic or metal mixing bowls (ore and/or fossil fuels mined from the earth). (slide 3)
- Instruct students to stay in a similar frame of thought and think about what is needed for farms to be able to produce the food we eat. Make a brainstorming list on the board of what your students can identify using their prior knowledge. (slide 4)
- Give each student one copy of The Environmental Cost of Food handout. (They will use this handout throughout the lesson for notes.)
- Watch, What contributes to the environmental impact of food? Add to the brainstorm list as students watch the video clip. Remind students that they should fill in the blanks of the footprint diagram on their handout as they watch the video. (Slide 6 has the image and captions if your students don't catch all of the details during the video clip.)
Activity 2: Identifying Environmental Impact from Farm-to-Fork
- Divide your class into 5 groups. Assign each group a table/area for their "station." Each station should have:
- One Environmental Footprint by Food Group card
- Corresponding flow chart
- Adaptation: If you'd like smaller groups for more engagement, print 2 copies of the flow charts and Environmental Footprint by Food Group cards and divide the class into 10 groups.
- Human Impact Disks
- Show students the short video tutorial illustrating what they will be doing in this activity. The Oilseed Crop Flowchart is used for the demonstration.
- Set a timer for 5 minutes. During this time, students should follow the instructions found on slides 7-8 of the lesson slide deck. Have each group rotate through each station.
- After each food group has been evaluated, ask the class (slide 9), "Do some foods require more natural resources to produce than others?" (Yes)
- Use the image on slide 10 to illustrate why animal-source foods require more natural resources to produce. (There is environmental impact from the production of feed for the livestock AND impact from the animals themselves.)
- Conclude with students that animal-source foods have two layers of environmental impact—the production of crops to feed livestock and the impact of the livestock themselves. In comparison, plant-source foods have a smaller environmental impact (per unit of food produced) than animal-source foods.
Elaborate
-
Show the video, The Carbon Footprint of a Sandwich.
Evaluate
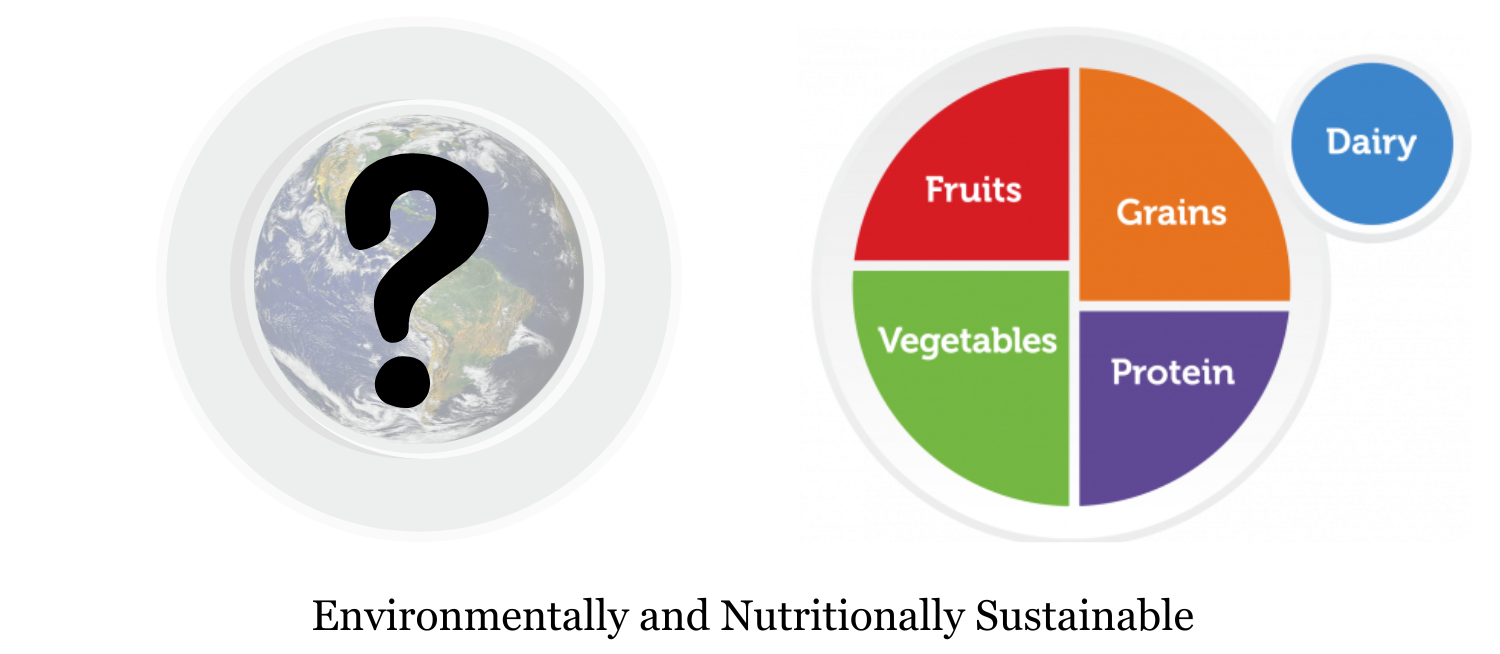
- Have students turn to the last page of the Environmental Cost of Food handout. Ask students to consider what they have learned so far and draw a pie graph on the plate that represents the portion of their diet each food group should represent to balance their human impact on the environment. Have students begin using a pencil in case they want to adjust the graph.
- Optional: Have students color the graph with colored pencils or crayons.
- Once students have completed the graph and written their conclusion and action statement, hold a class discussion. Point out that their pie graph of recommended food groups only represents human impact and environmental sustainability. Ask, "What other factors should be considered?" Provide prompts as needed to help students identify nutrition, culture, and economy as important factors (slide 11).
- Display the MyPlate food diagram (slide 12). Ask students to look at their plate portions and determine if their environmentally balanced plate has any similarities to a nutritionally balanced plate. Discuss how both of these important factors can be considered.

Teach for Clarity
This lesson is written from the perspective of science. However, for students to gain knowledge and a balanced evaluation of the topic, it is recommended to make cross-curricular connections to social studies topics such as hunger, malnutrition, or geography. There are differences between developed and developing countries in reference to their food resources. Due to climate, some geographic areas of the world rely on livestock farming for economic and nutritional stability because fruits and vegetables cannot be grown in their climate or transported effectively.
- Review and summarize the following key concepts:
- The production (on the farm) and distribution of food contributes to our overall human impact on the environment. It can be known as the environmental "footprint" of food.
- Major factors included in the environmental footprint of food include: water use, energy, greenhouse gas emissions, inputs (fertilizer, pesticides, etc.), waste, land use, and transportation.
- Some foods require more natural resources than others.
- Eating foods following the nutritional guidelines of MyPlate (with plant-source foods being a majority) is environmentally sustainable.
Sources
- United Nations Climate Action: Food and Climate Change: Healthy diets for a healthier planet
- Our World in Data: What are the environmental impacts of food and agriculture?
- Our World in Data: Key insights on the Environmental Impacts of Food
- Our World in Data: Very little of global food is transported by air; this greatly reduces the climate benefits of eating local
Recommended Companion Resources
- Food for the Future: Sustainable Farms Around the World
- Livestock Production e-Magazine
- Environmental Cost of Food Kit
- On the Flip Side Cards
- How to Feed the World in 2050: Actions in a Changing Climate Video
- Environmental Footprint of Food Poster
- Smarter Food: Does Big Farming Mean Bad Farming?
- Like Your Food? Thank a Trucker
Author
Andrea Gardner
Organization
National Center for Agricultural Literacy (NCAL)