 Relevancy and Engagement
agclassroom.org
Supply and Demand: What If?
Grade Level
6 - 8
Purpose
Students will demonstrate understanding of the importance of the relationship between producers and consumers by explaining how agricultural supply and demand affects commodity prices. Grades 6-8
Estimated Time
Two 45-minute sessions
Materials Needed
- Supply & Demand Vocabulary activity sheet, 1 per student
- Supply & Demand In Agriculture—Terminology handout, classroom set
- Rise or Fall slides (projector and screen)
- Graphing Supply and Demand Curves activity sheet, 1 per student (Key)
Vocabulary
commodity: a primary agricultural product that can be bought and sold
consumer: a person who buys and uses goods and services
demand: a consumer's willingness and ability to buy a product
supply: how much of a good or service is available
Did You Know?
- US consumers spend just 10 percent of their disposable income on food each year, while those in other countries spend much more.1
- On average, each person in the United States spends approximately $4500 per year on food.1
- There were 8268 farmers markets in 2014, a 180 percent increase since 2006.1
Background Agricultural Connections
Farmers and consumers rely on one another. Not only would one not exist without the other, but the actions of each depend upon the actions of the other. Theirs is an interdependent relationship.
Farmers produce agricultural commodities which supply us with food, fiber (such as cotton for fabric), and some types of fuel (ethanol and other biofuels). These raw products enter into a market where price is determined by the interaction of demand and supply. A consumers' willingness and ability to buy a product (demand) and the sellers' willingness and ability to produce and sell the product (supply) determine the market price of agricultural commodities.
The demand for agricultural products is influenced by many factors, including consumer tastes and preferences. Consumers create and follow eating trends that are influenced by both scientific research and social influences. For example, discovering the health benefits of lean meats increases the demand for chicken and lean cuts of pork and beef, and decreases the demand for meat products high in saturated fats. Other dietary trends such as gluten-free and low-carb diets increase the consumption (demand) of related commodities and potentially decrease the demand for others.
Social influences also play a role in creating demand for agricultural goods. For example, some consumers prefer buying food labeled and produced in a specific way, such as free-range eggs, grass-fed beef, organic milk, etc. The number of buyers in a market impacts demand too. The more buyers in a market, the greater potential for demand. Consumer income also plays a role in potential demand. With some products, an increase in consumers' income leads to greater consumption. Similarly, a decrease in consumers' income can lead to a decrease in the consumption of non-essential foods. Availability of related goods also impacts demand. Many agricultural products have similar substitutes. For example rather than drinking cow milk, a consumer may drink soy, almond, or rice milk based upon the cost, availability, and preference of one milk over the other.
Supply is determined by the available amount of a commodity at a particular time. An increase in production costs may decrease supply. For example, if feed costs go up, farmers may sell their livestock earlier or decrease the size of their herd to reduce their expenses. Doing so will decrease the overall supply. Technology on the farm can increase agricultural supply if it improves overall production efficiency. For example, improving varieties of wheat through artificial selection and plant breeding can allow a farmer to harvest more wheat on the same amount of land, thus increasing the supply. Other factors impacting supply include taxes, subsidies, the cost of related commodities, and the number of sellers in a specific market.
An increase in the demand for a product without an increase in the supply will lead to a higher market price. An increase in the supply of a product without an increase in demand will lead to a lower price for the product.
Engage
- Choose an item that many of your students would want, such as a video game, movie, iPod, iPad, cell phone, etc. Find an average retail price for the product and write it on the middle of your white board.
- Ask students by the raise of hands how many of them would want that item for the average price. Record the number in the middle of the board.
- Next, raise the price of the item and ask the students to raise their hands if they are still interested in the item for the higher price. Record the number on the far right side of the board.
- Now lower the price to below average and count how many students are interested in the item. Summarize this activity and introduce the lesson topic. Students will learn about the basic principles of supply and demand and how supply and demand affects market prices.
Explore and Explain
Activity 1: Will It Rise or Fall?
- Give each student one Supply and Demand Vocabulary activity sheet along with one Supply and Demand In Agriculture—Terminology handout. Allow students time to complete the activity sheet. Help students determine how to illustrate each term as needed. Once students complete the vocabulary activity sheet, they should have a basic understanding of supply and demand and the associated terms.
- Use the Rise or Fall PowerPoint to illustrate examples of situations that make supply and demand rise and fall. With each example instruct students to give you a “thumbs up” if the supply or demand rises and a “thumbs down” if it falls. Use additional examples as necessary for student comprehension.

Activity 2: Graphing Supply and Demand Curves
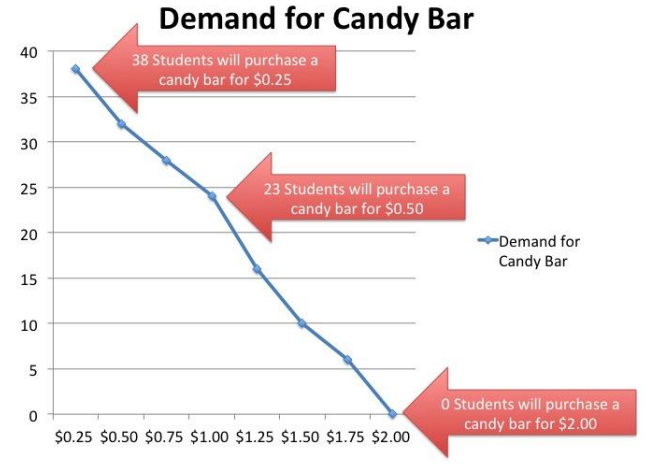
- Begin this section by doing a class activity. Get a candy bar and hold it up in front of the class. Tell students that you are going to hold an auction. Auctions sell items by starting at a low price and eventually selling to the highest bidder.
- Begin the auction by offering the candy bar for 25 cents. Each student who is willing to pay 25 cents for the candy bar should raise their hand. Count the students and record the number on a graph.
- Continue the auction by increasing the bid by 25 cents and recording how many students are willing to purchase the candy bar at each price level.
- Continue until no students (zero) are willing to pay for the candy bar. The resulting graph will show a demand curve. The graph can be drawn on the board or created on the computer.
- Once you have completed the example in class, pass out the Graphing Supply and Demand Curves activity sheet, and allow students time to complete it. Review math and graphing principles as necessary for successful completion.
Concept Elaboration and Evaluation
- Elaborate on careers in advertising and marketing by gathering commercials promoting agriculture and specific food products to share and discuss with students. For example:
- California Cow commercials promote dairy products and sound agricultural production practices.
- Beef, It’s What’s For Dinner commercials promoting beef products.
- California Cow commercials promote dairy products and sound agricultural production practices.
- Explain that each of these commercials and ad campaigns required graphic designers, videographers, dieticians, etc. for successful completion.
Evaluate
After conducting these activities, review and summarize the following key concepts:
- The economic value of agricultural products is affected by supply and demand.
- Farmers depend on consumers to purchase their products and consumers depend on farmers to produce the things they need and want.
- Careers in advertising and marketing help farmers sell their products and consumers find the products they want.
Sources
Recommended Companion Resources
Author
Andrea Gardner
Organization
Utah Agriculture in the Classroom
