 Relevancy and Engagement
agclassroom.org/
Relevancy and Engagement
agclassroom.org/
Agricultural Production Regions in the United States
Grade Level
9 - 12
Purpose
Students investigate US crop and livestock production and analyze the relevance of land use models in contemporary agricultural production. Grades 9-12
Estimated Time
Two 50-minute class periods
Materials Needed
Engage:
Activity 1: Agricultural Regions
- USDA Farm Resource Regions
- US Farm Resource Regions Map, 1 per student
- Food and Farm Facts booklet and map insert from American Farm Bureau Federation
- ERS State Fact Sheets (select a state and click on “Top Commodities” link)
- State Agricultural Facts
- Colored pencils
Activity 2: Maps and Food
- Map #1, American Agriculture in 1922 from 40 Maps That Explain Food in America
Activity 3: Rural Land Use Models
- Blank sheets of letter-sized white paper, 1 per student
- Rural Land Use Models handout (optional)
Vocabulary
Boserup, Ester: Danish agricultural economist who observed human-environment relationships
Census of Agriculture: a complete accounting of US farms and ranches and the people who operate them; taken once every five years by US Department of Agriculture’s (USDA) National Agricultural Statistics Service (NASS)
commodity: a primary agricultural product that can be bought and sold
commodity chain: the set of activities involved in the creation of a good or service; each part of the process, including production, distribution, and consumption, represents a discrete link in the chain
family farm: a farm in which ownership and control of the farm business is held by a family of individuals related by blood, marriage, or adoption
farm: an area of land used for growing crops or rearing animals
Farm Resource Region: US regions map constructed by US Department of Agriculture’s (USDA) Economic Research Service to portray geographic distribution of US farm production
Sauer, Carl: an influential cultural geographer who believed that humans control nature and develop their cultures out of that control
von Thünen, Johann Heinrich: farmer and economist who studied the relationships between land costs and transportation costs
Did You Know?
- The current world population is approximately 7.6 billion people. By 2050, it is predicted that world population could reach 9.8 billion people.1
- The top five states in 2017 agriculture sales were California, Iowa, Texas, Nebraska, and Minnesota, respectively.2
- The state of Texas has the most farms and largest farm acreage of all 50 states.3
- Cattle and calves ranked highest in terms of market value of US livestock agriculture products sold in 2017; corn ranked first for crop products sold.2
Background Agricultural Connections
The US farmer is the most productive in the history of the world. Interestingly, The World Factbook of the CIA reports that farming, fishing, and forestry represent only 0.7% of the US labor force. Food is more affordable, more abundant, and is safer in the United States than in any other developed country in the world. Although there is a trend toward fewer farms producing an increasing share of agricultural products in this country, US agriculture is positioned to provide for food and fiber needs on a global scale.
According to the 2012 Census of Agriculture—USDA’s complete accounting of US farms and ranches and the people who operate them—of the 2.1 million farms in the United States in 2012, 97 percent were family-owned operations. Only 3 percent of farms were non-family corporations, but they accounted for 16 percent of the value of all US agricultural products sold. Note that the USDA defines farm as any place from which $1,000 or more of agricultural products were produced and sold during the year. A family farm is owned and controlled by a family of related individuals.
The United States has more arable land (land suitable for growing crops) than any other nation in the world. Approximately 40 percent of all US land—totaling 915 million acres—was farmland. Of that farmland, 45.4 percent (415.4 million acres) was permanent pasture, 42.6 percent (389.8 million acres) was cropland, and 8.4 percent 76.9 million acres) was woodland. Farmsteads, buildings, and livestock facilities covered the remaining 3.6 percent (32.9 million acres) of farmland.
Farmland is most heavily concentrated in the middle of the United States. The Economic Research Service (ERS) of USDA reports that agriculture production occurs in each of the 50 states. However, that production is as diverse as the states themselves. California leads the country as the largest producer of crops and livestock, accounting for approximately 11 percent of the national total in terms of sales. Crop production is concentrated in California and the Midwest (Iowa, Illinois, Minnesota, and Nebraska) while livestock production is scattered across the country with Texas, Iowa, California, Nebraska, and Kansas leading in sales value.
Despite the growing population, the number of US farms in 2012 declined as compared to the 2007 Census of Agriculture, from 2.2 million to 2.1 million. The decrease in the number of farms is particularly evident in the Southeast and Midwest. During the same five-year period, the amount of land in farms changed very little but with minimal decline, resulting in slightly larger farms (average farm size was 4.34 acres in 2012). This modest decline is spread fairly evenly across the country. However, even this small loss of farmland is an important issue. Estimates vary among sources, but the Farmland Information Center—a partnership between American Farmland Trust and USDA’s Natural Resources Conservation Service—estimates that 50 acres of farmland is lost every hour to development.
In 2000, USDA’s ERS constructed a map of regions depicting geographic specialization in production of US farm commodities. The boundaries of these Farm Resource Regions are not constrained to state boundaries; they are bound within areas of similar physiographic, soil, and climatic traits, as reflected in USDA’s Land Resource Regions. The Land Resource Regions are geographically associated groups of major land resource areas that have broadly related patterns of soil, climate, water resources, and land use.
The commodities produced in these resource regions are the bases of innumerable consumer products. A commodity is a raw material (e.g., eggs, sugar, corn, beef, milk) or primary agricultural product that is bought and sold as an input in the production of goods. The commodity chain of an agricultural product is a complex system of the production, sale, and distribution of an end product.
For centuries, adequately feeding a growing population has prompted a number of theories regarding rural land use and food supply. Three of these theories are summarized below:
- Carl Sauer (1889-1975) was an American geographer who developed a theory called “cultural history” which involved gathering facts about humans’ impact on the environment over time. He believed that agriculture had an impact on the physical landscape. Sauer studied the creation of the “cultural landscape” which included general geography, regional geography, and historical geography, and the impact that humans have on the environment, i.e., human-environment relations. Most of Sauer’s research was conducted in Latin America and less industrialized areas of the United States.
- Ester Boserup (1910-1999) was a Danish agricultural economist who observed human-environment relationships. She challenged Thomas Malthus’ theory that population’s exponential growth would overcome agriculture’s geometric growth, thereby resulting in a starving population. Boserup believed that people addressing this challenge through technological change and the advancement of agricultural practices would feed an increasing population. In other words, although the rate of food supply may vary, the population never exceeds what the environment can sustain, because every time the food supply nears its limit, there is an invention or development that causes it to increase. Boserup developed her ideas in connection with traditional farming systems in Southeast Asia, but her ideas have been applied to global agricultural patterns.
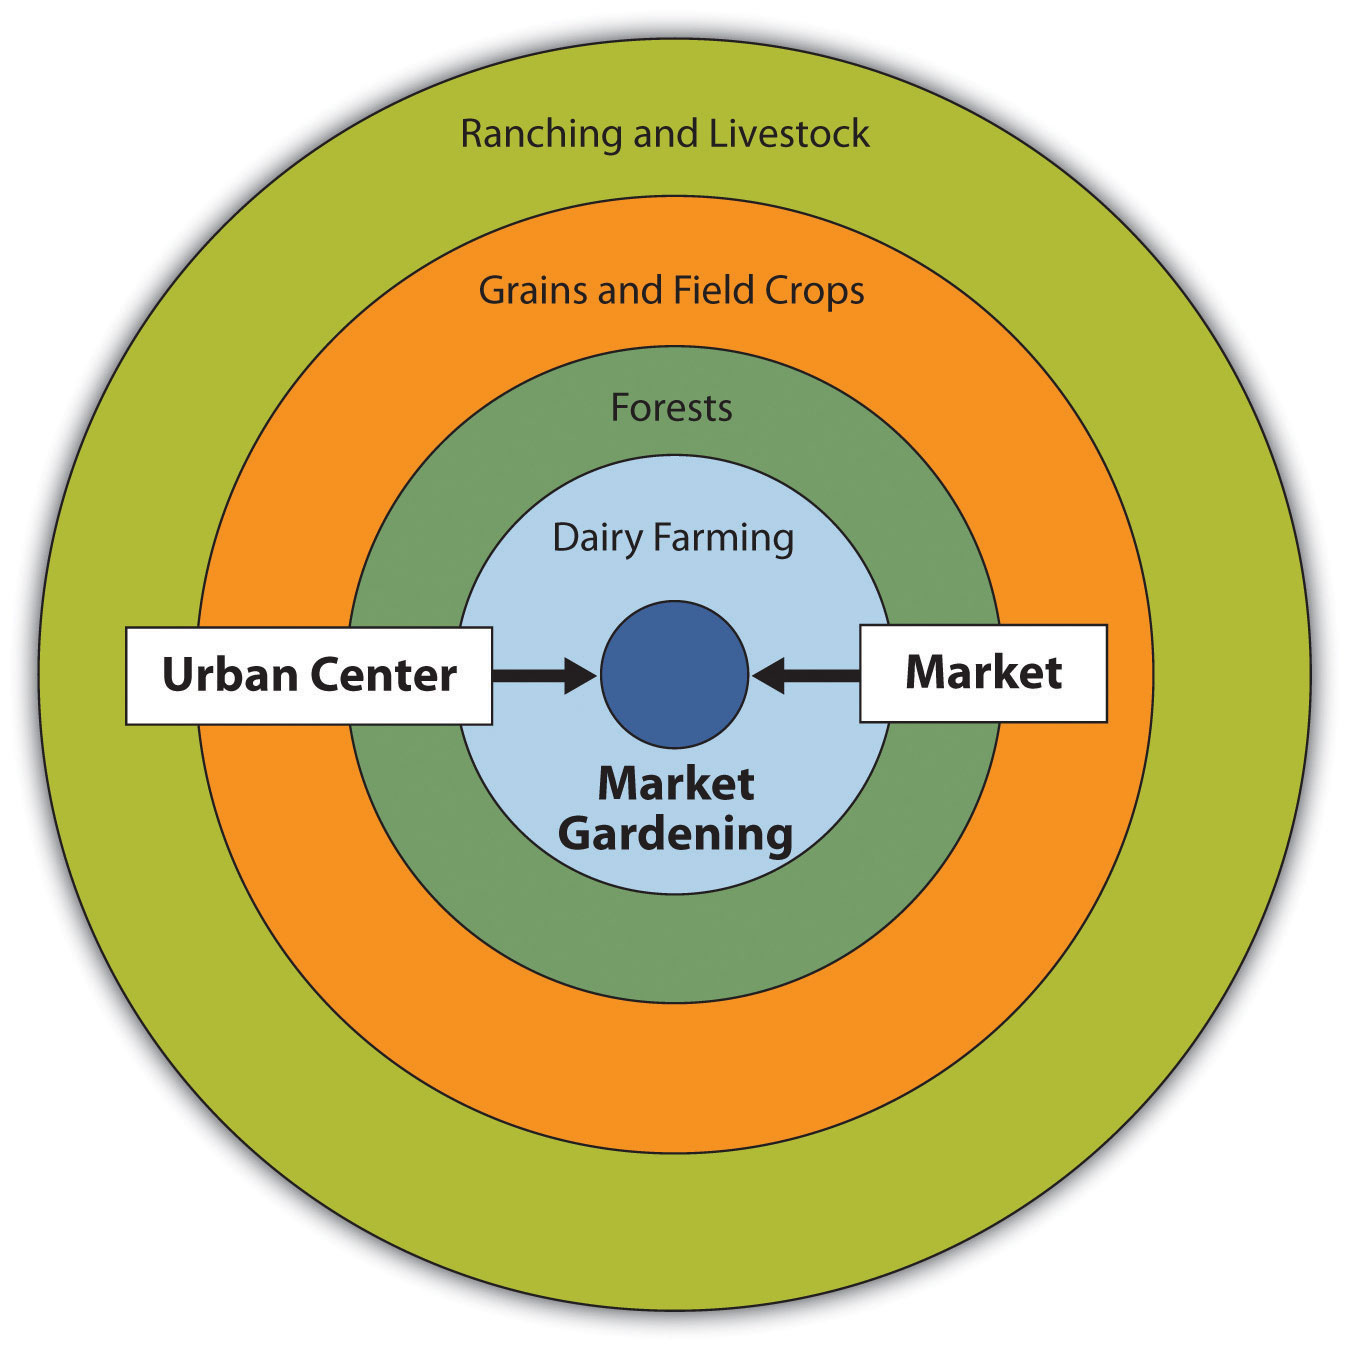 Johann Heinrich von Thünen (1783-1850) was a farmer and amateur economist who studied the relationship between land cost and transportation costs in an isolated state. Typically, the closer one gets to a city, the higher the price of land. Farmers of the isolated state balance the cost of transportation, land, and profit, and produce the most cost-effective product for market. Consequently, von Thünen theorized that—based on several limiting assumptions—in an isolated state, a pattern of four agricultural rings would emerge around a city. Starting closest to a central city, these rings include intensive farming and dairying, forest, extensive field crops, and ranching.
Engage
- Show students the video Growing Today for Tomorrow. Let them watch it the first time without taking notes (it is brief—3 minutes, 30 seconds).
- Watch it a second time and instruct students to take notes on some of the specific information presented.
- Following the viewings, ask students the following questions:
- What did you find most interesting about the information presented in the video?
- What agricultural challenges face our planet in the coming years?
- Will farmers be able to keep pace with agricultural production in regards to a growing world population? (Show the World Population Clock.)
Explore and Explain
Activity 1: Agricultural Regions
- Distribute a blank US Farm Resource Regions Map to each student, and assign one of the nine farm resource regions to each student.
- Either project the USDA Farm Resource Regions PDF for student viewing, or distribute a printed copy of the regions to each student. Using this map as well as the Food and Farm Facts map insert from Farm Bureau, the ERS State Fact Sheets and/or the State Agricultural Facts, instruct students to identify the five major agricultural products produced in their assigned region.
- Using their blank maps, instruct students to draw images in their assigned farm resource regions that depict the five products identified in Step 3. Students should create legends for their maps.
- Use a Think-Pair-Share strategy and ask students to discuss the following question with their partner: What geographic factors influence the production of the major crops of your farm resource region?
- Conduct a class discussion in which students share their thoughts on the aforementioned question. Also ask students, “If you could only eat foods local to your farm resource region, what foods would you miss the most from those you typically eat?”
Activity 2: Maps and Food
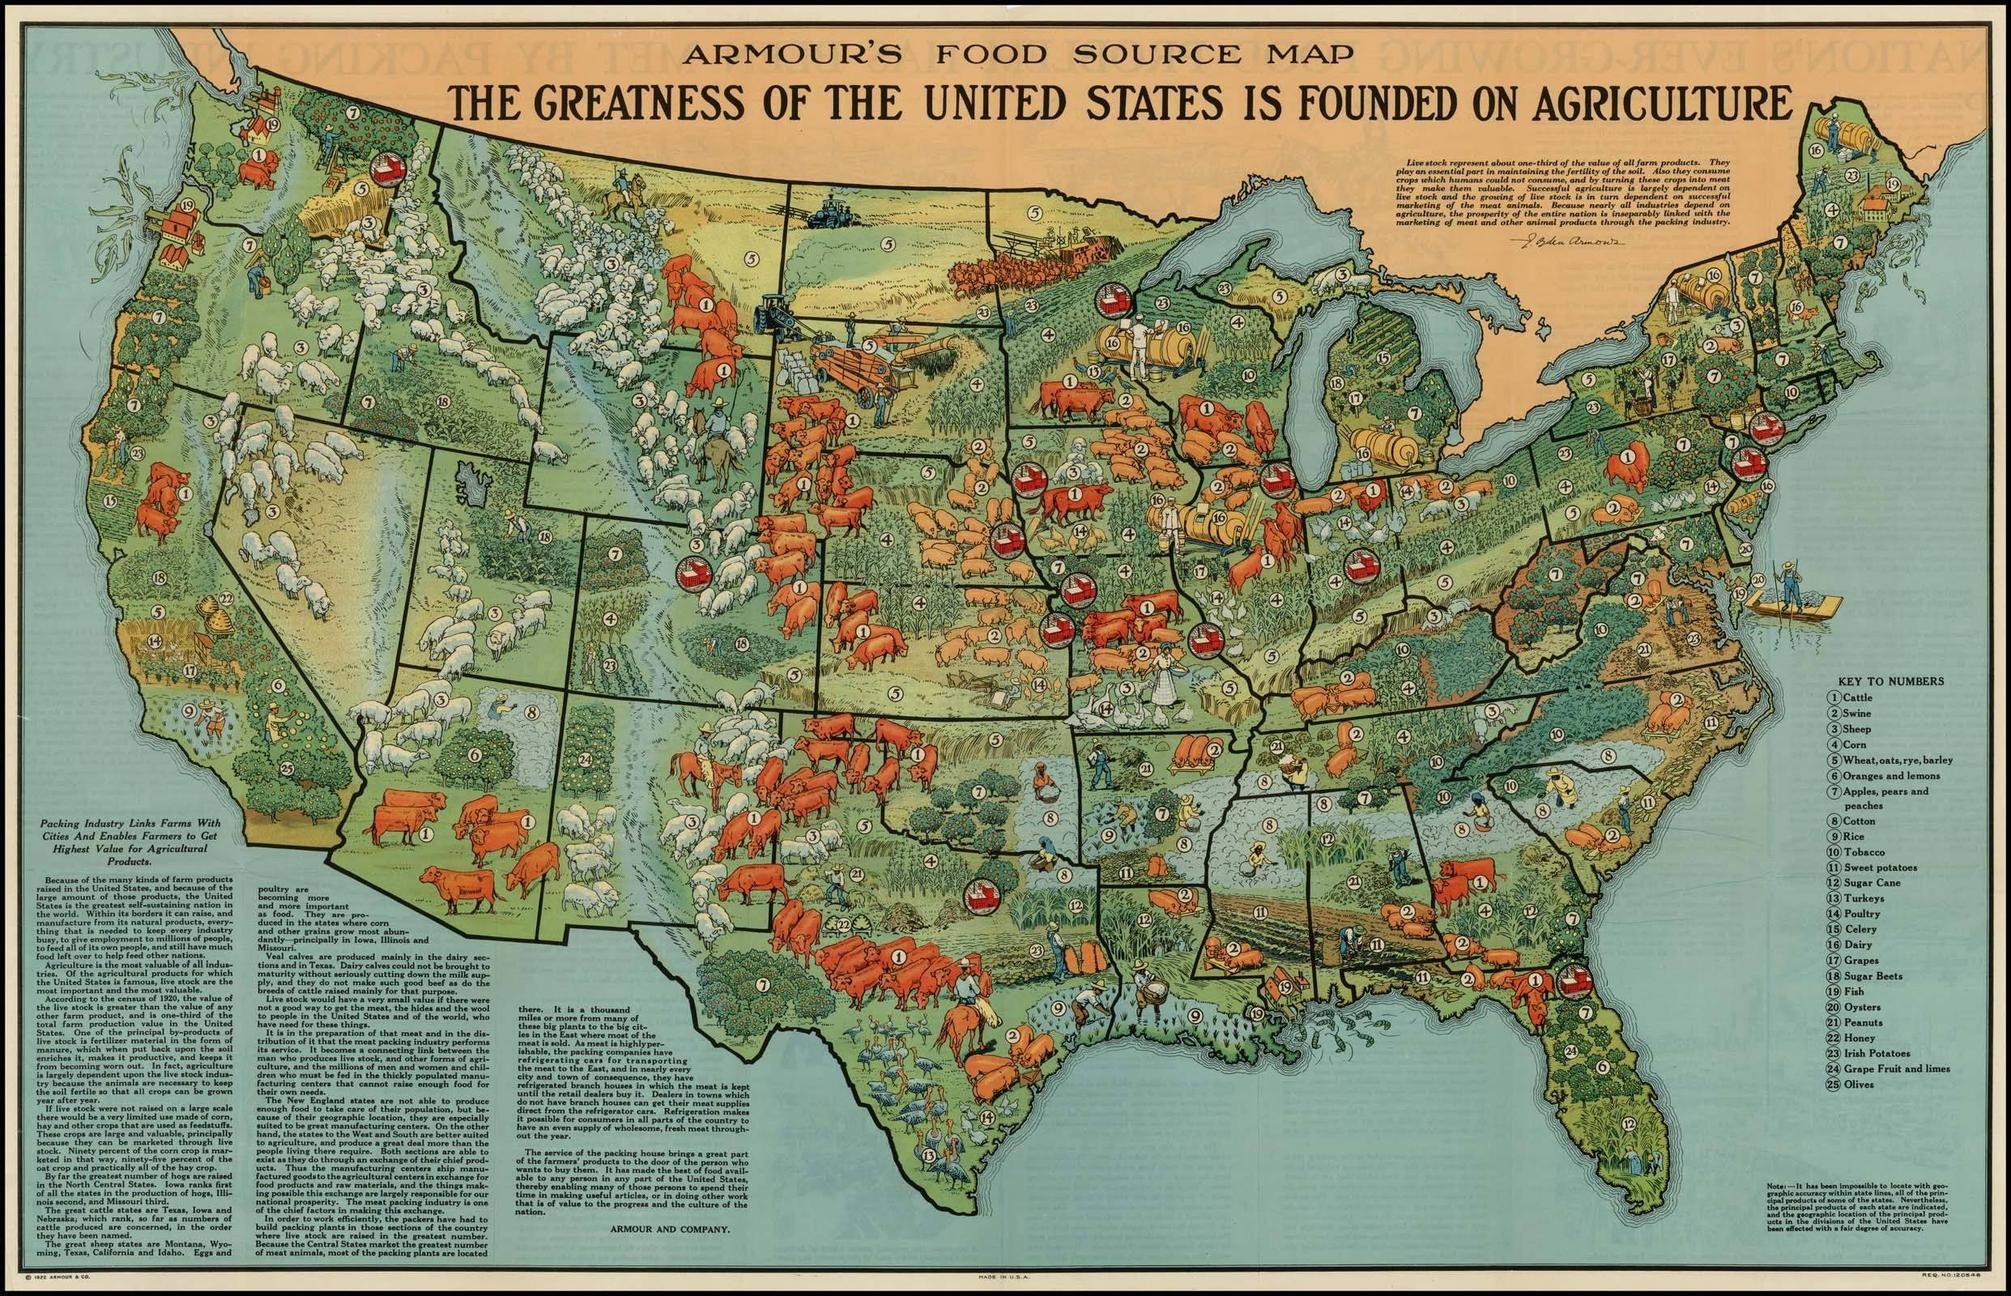
- Use a projection system or print copies of Map #1, American Agriculture in 1922 from 40 Maps That Explain Food in America. Instruct students to compare the agricultural products currently produced in their assigned regions to the products produced in 1922.

- Ask students to share their responses to the following questions:
- What specific agricultural products have changed over the past nine decades?
- Why has the production of certain agricultural products of a particular region changed?
- What forecasts regarding future agricultural production might be made in terms of economics, labor, and geographical locations?
Activity 3: Rural Land Use Models
- Review the three rural land use models described in the Background Agricultural Connections section of the lesson. This information is also provided in the Rural Land Use Models handout, which you may choose to provide to students as a reference.
- With the same partners from Activity 1—or new partners, if desired—instruct students to use sheets of white paper to answer the following questions (students may use words and/or pictures):
- Considering Carl Sauer’s cultural history theory, what human-environment impacts are evident in regards to the agricultural products produced in your farm resource regions?
- What agricultural production technologies are responsible for supporting Ester Boserup’s theory of population and food supply?
- Draw a diagram of von Thünen’s rural land use model and identify where the agricultural products of your regions fit into that model by drawing icons of the products in their respective rings.
- Conduct a class discussion in which students can share their thoughts on the first two questions above. Ask students, “Does von Thünen’s model of rural land use still apply to contemporary agricultural production in your farm resource regions? Why or why not?”
Elaborate
-
Using a projection system, show students Map #5, Where are People Making Money from Crops and Where from Livestock?, from 40 Maps That Explain Food in America. Are there geographical factors that influence this economic activity?
-
Using a projection system, show students Map #6, Which Crops are Harvested Where?, from 40 Maps That Explain Food in America. What might be the risks and/or benefits of growing monocultures such as corn and soybeans?
-
Look at the Level II Ecoregions of North America map provided on the EPA website with your students. Using their US Farm Resource Region Maps, instruct students to identify the main ecological region(s) associated with their assigned farm resource region and label it on their map. What relationships exist between the ecological regions and the agricultural products produced in students’ specific farm resource regions?
Evaluate
After conducting these activities, review and summarize the following key concepts:
- Production and distribution of food is affected by the relationships between geography, politics, and economics.
- Physical geography is closely connected to agricultural practices.
- Agricultural production regions can be associated with ecological regions or bioclimatic zones.
Sources
Acknowledgements
von Thünen’s Rural Land Use Model (Creative Commons by-nc-sa 3.0 license)
Contributors
Doug Andersen (UT), Nancy Anderson (UT), Paul Gray (AR), Ken Keller (GA), Lisa Sanders (MN), Sharon Shelerud (MN), Allison Smith (UT), Kelly Swanson (MN)
Recommended Companion Resources
- 40 Maps that Explain Food in America
- Ag Census Web Maps
- Ag States of America
- Amelia's Road
- Crop Intensity Maps
- Dirt to Dinner
- Dirt-to-Dinner: Food Matters
- Food and Farm Facts Booklet
- Growing Today for Tomorrow
- How America Uses Its Land
- How Does it Grow? Video Series
- Interactive Map Project
- Planet Money Makes a T-shirt
- Population, Sustainability, and Malthus: Crash Course World History video
Author
Denise Stewardson
Organization
National Agriculture in the Classroom